


MODIS Data Collections now on CREODIAS
A key selection of MODIS collections is now available within the CDSE and CREODIAS data repository, making this dataset directly accessible for research and operational use.
Remote Sensing in Beekeeping
EO-powered Hive Mind helps beekeepers place apiaries smarter, using CREODIAS data to map forage, predict nectar flows, and cut overstocking.
Semantic search of satellite data with AI embeddings
In this article, we show how embeddings map satellite imagery and text into a shared vector space, turning raw pixels into meaning so natural-language queries like “snow-covered mountains” retrieve the right scenes instead of rigid labels.
Using CREODIAS for water quality monitoring
This study focuses on Manila Bay, a critical coastal region in the Philippines that supports fisheries, trade, and the livelihoods of millions of people in Metro Manila. For this analysis, Sentinel-2 imagery acquired on 01/06/2025 was used.
Detecting anomalies in satellite data with AI embeddings
AI embeddings from EO foundation models, analyzed with PCA/cosine similarity on CREODIAS, reveal temporal and spatial anomalies in large satellite imagery.
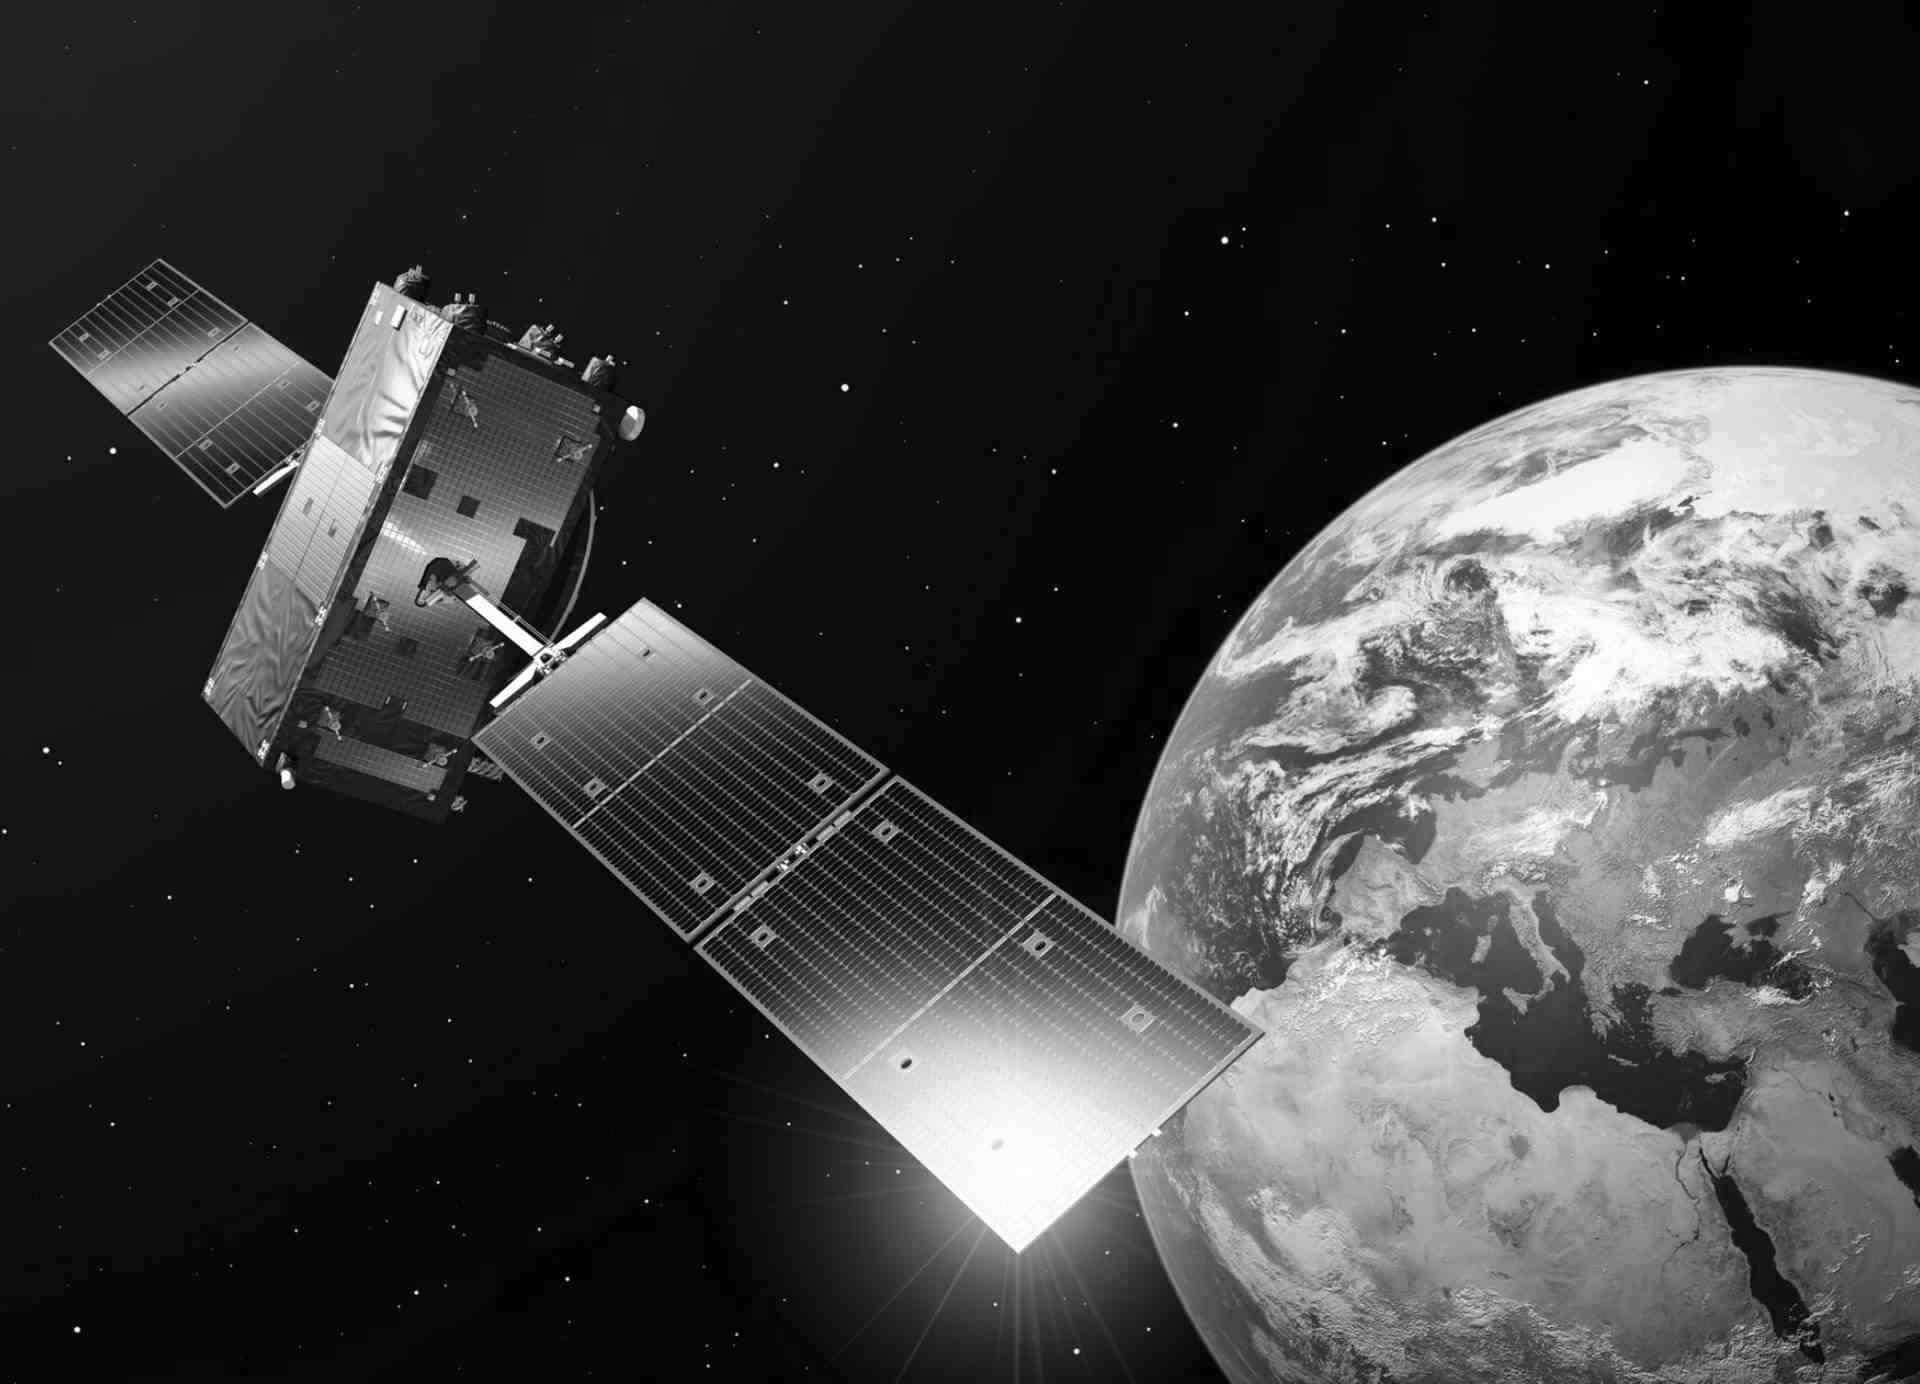
Sentinel-6: Monitoring Ocean Changes from Space
Read an article about Copernicus Sentinel-6. It is a satellite mission carried out within the Copernicus programme. Its task is to monitor changes in sea and ocean levels with unique accuracy. The satellite is equipped with advanced altimetric instruments, enabling precise measurements of water surface topography. The data obtained by Sentinel-6 are crucial for studying climate change, analyzing ocean dynamics, and predicting extreme weather phenomena such as hurricanes.
Mapping wetlands fire using AI and Sentinel-2 data
One of Europe's largest wetland complexes, the Biebrza Wetlands in northeastern Poland, forms the Biebrza National Park and is protected under the Ramsar Convention. On April 20, 2025, a fire broke out in the area. To assess the damage, we used Copernicus Sentinel-2 satellite imagery obtained from the CREODIAS service.
Using CREODIAS for oil spills monitoring
While object detection algorithms can be effective for detecting oil spills in satellite images, in this project a U-Net convolutional neural network was chosen for semantic segmentation, this approach produces binary masks that predict where an oil spill may be present.
Satellite-based wildfire monitoring in California using EO data on CREODIAS
See a use case carried out on CREODIAS, where Copernicus Sentinel-2 data was used for analysing wildfires in Los Angeles.