EO Data Statistics
Historical information about cumulative number of data catalogues processed - available via CREODIAS interface - from the inauguration of the service, to a certain time stamp: year, month, day and hour respectively. Graphs displaying cumulative information about number of products are updated every month, week and hour accordingly to information presented. Graph on number of products processed each year is updated every month
Latest volume of data per satellite
S2 Scenes
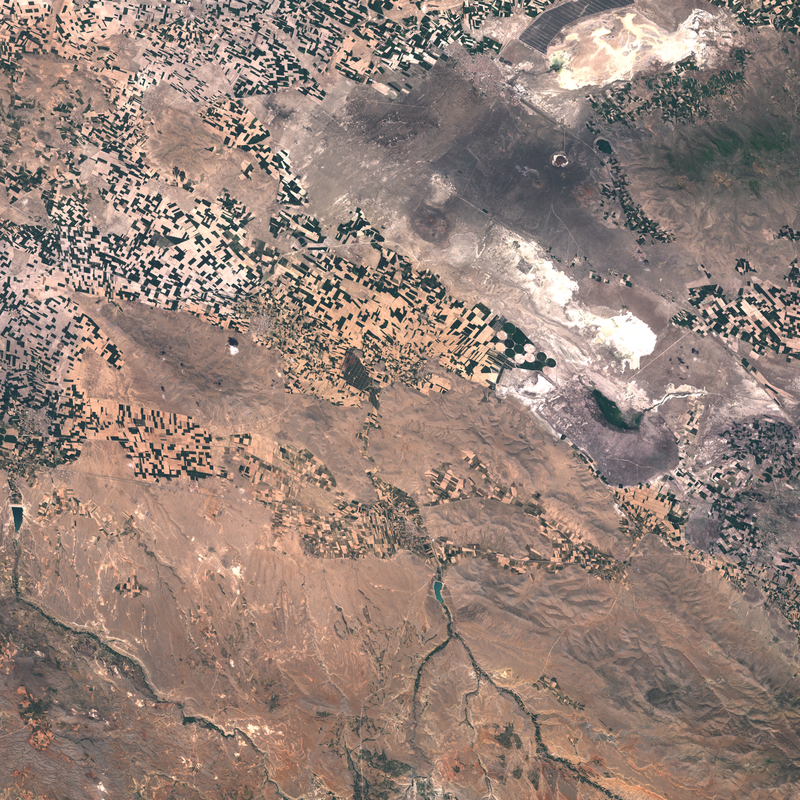
S2 Scenes is a sample DIAS Front-Office application, demonstrating sample usage of Earth Observation Data.

EO Products Statistics
Information on performance indicators showing current and historical status of the CREODIAS platform.
Latest number of data per satellite

