


CREODIAS for emergency fire management
Wildfires are one of the greatest threats to the ecosystems and the potential losses cover all its elements: wildfires affect soil cover, vegetation, fauna mortality, and the atmosphere, releasing greenhouse gases that affect the composition and its functioning, but also wildfires are a threat to human life and the economy, especially in places where the occurrence of wildfires is not a typical phenomenon.
The use of Copernicus data allows for cost-effective, accurate, up-to-date (in the near real-time), and efficient analysis of vast areas in the assessment of fire risk, as well as the analysis of the fire area and the extent of degradation of the natural environment. CREODIAS platform, which is a cloud computing environment integrated with approx. 30 PB of EO data, enables effective mapping of wildfires as well as assessment of environmental losses. This is made possible by direct and immediate access to near real-time satellite data, as well as the entire archive. The computing environment linked to the satellite data repository allows for the analysis of huge amounts of data without the need to download it into the user's infrastructure.
Fire hazard analysis
Fire risk management let us take preventive measures and efficiently manage a rescue operation in the event of a fire. Emergency services can receive precise information on the scale and location of the fire. For these fire detection purposes, a wide range of ready-to-use satellite-derived products is generated in a frame of the Copernicus programme. These include e.g.
- Fire Radiative Power (FRP) standard product derived from Sentinel 3 that can be used to monitor the amount of burned biomass, as these measurements constitute an accurate, validated, and daily updated dataset with surveillance of the entire area.
- NDMI Normalized Difference Moisture Index (NDMI) Moisture Index includes canopy stress analysis, productivity prediction and modelling, fire hazard analysis, and studies of ecosystem physiology.
- Land Surface Temperature (LST) from the SLSTR products the temperature of the top surface when in bare soil conditions, and the effective emitting temperature of vegetation "canopies" as determined from the view of a canopy top. (SentinelCopernicus)
Burnt area analysis
The high spectral resolution of the Sentinel-2 satellites let us conduct an accurate study of the area exposed to fire.
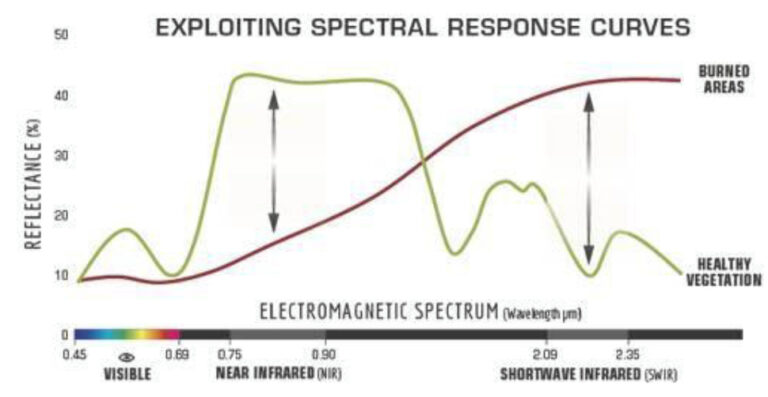
Thanks to the use of simple remote sensing indicators, we can highlight the fluctuation of radiation reflection in these ranges and quickly determine the range of the area where the fire occurred:
- Normalized Difference Vegetation Index (NDVI) has been widely used as an indicator of land cover structure, biomass, or vegetation condition and vigor can also be used to study land cover changes, especially the consequences of natural disasters, including wildfires.
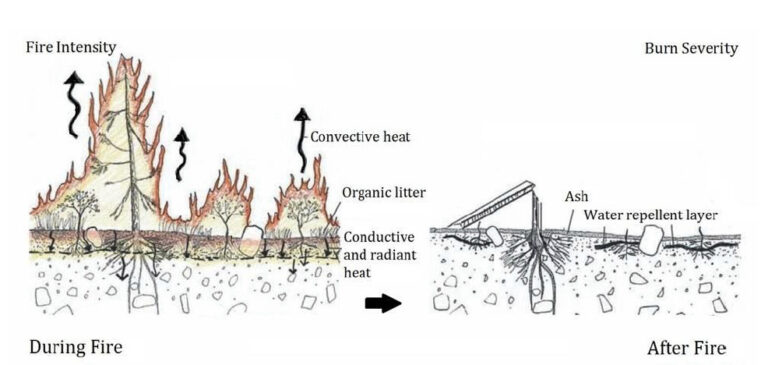
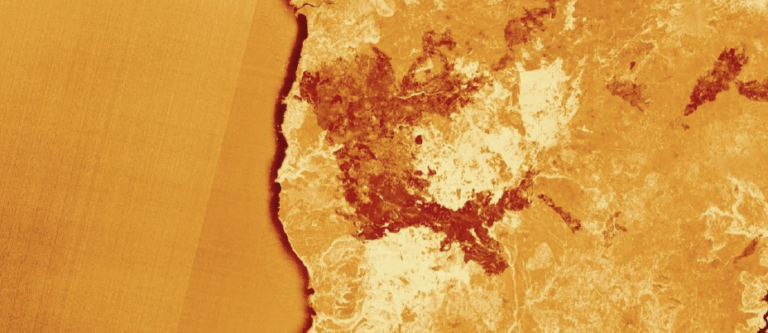
- Normalized Burn Ratio (NBR) and Burn Area Index (BAI) are the fire intensity indicators that provide information about the extent to which the area has been burnt and about the degradation of vegetation.
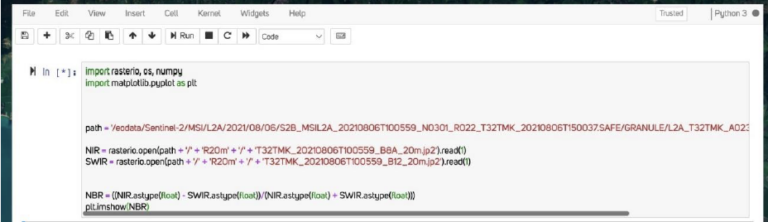
NBR index calclulations on the Jupyter notebook
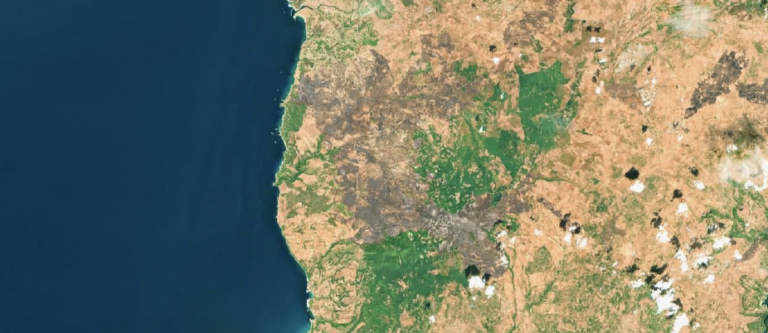
In 2021 several hundred people were evacuated from their houses in an area of the city of Oristano, Sardinia. The fire destroyed 20,000 hectares of forests. Fire risk due to wind was defined as extreme.
Normalized Burn Ratio (NBR) is calculated as a ratio between the NIR and SWIR values to the point burned area. By creating a simple Python script to calculate the NBR index in the Jupyter notebook we can estimate the size of burn severity. The NBR indicator highlights areas where a fire has occurred.
Solution on CREODIAS
CREODIAS providing both resources of computing power in virtual machines and access to the Copernicus services products, let users create a suitable environment for both public and private sectors to monitor or provide early warning of fires on a regional or national scale. By using satellite data users can find spatial patterns that may provide improvements in the emergency management and the analysis of the fire effects. CREODIAS data repository and cloud computing services enable users to automate processes and calculate big datasets to better understand the phenomena occurring in the natural environment, especially in hard-to-reach locations.
Author: Maciej Jurzyk, Earth Observation Product Specialist at CloudFerro