Monitoring Vegetation Using Sentinel-1 Data: the RVI Calculator
The most popular approach to monitoring vegetation involves analyzing optical data. However, this method has limitations - optical data cannot be used during high cloud cover or nighttime. Fortunately, vegetation analysis is also possible using radar data. For instance, vegetation cover and height can be assessed by calculating the Radar Vegetation Index (RVI). Radar data overcomes issues related to cloud cover and time of day, as radar can capture data regardless of these factors.
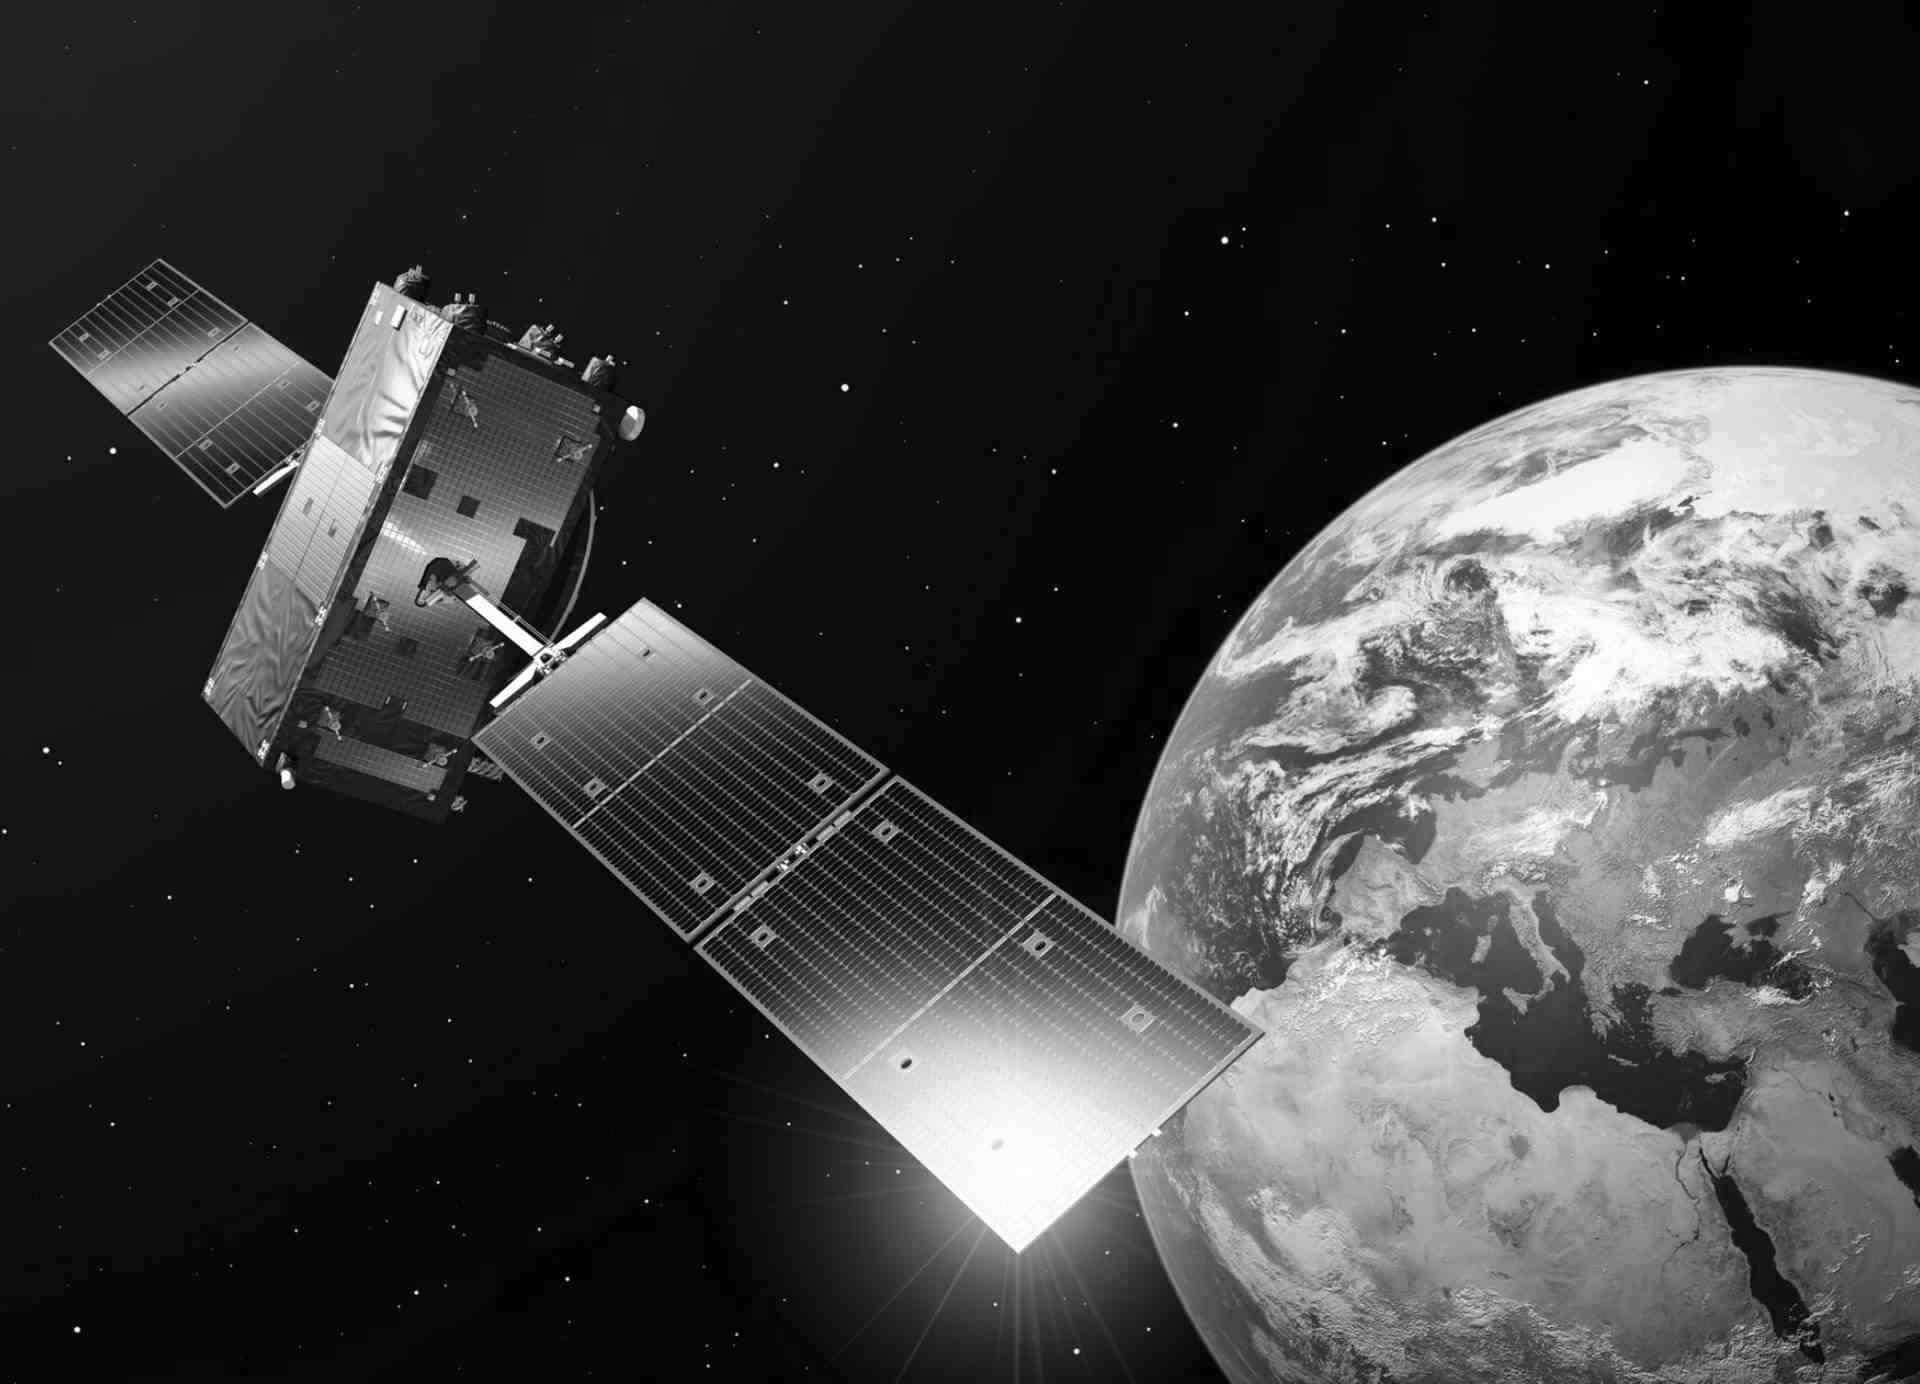
The project presented below used radar data from Copernicus Sentinel-1, with dual VV and VH polarization modes. The VV polarization is a mode, where both the transmission and reception of the radar signal occur in vertical polarization. This configuration is effective in detecting vertical structures and is less susceptible to interference from forests. The VH mode, where the signal is transmitted in vertical and received in horizontal polarization, is more sensitive to terrain irregularities and is useful in distinguishing different types of vegetation. The data were sourced using the CREODIAS platform.
For the analysis, a study area near the Kampinos National Park in central Poland was selected.
The data processing involved creating a graph in SNAP software using the GUI on a virtual machine and then exported to an XML file. Then, the graph was parameterized to allow for the input of different file paths and executed from Python using the subprocess module.
In the first step, to improve geolocation, the raster metadata was replaced with more precise data by the "Apply Orbit File" option.
Next, using the “Thermal Noise Removal”, thermal noise originating from the electronic components of the radar system was removed. Using “Calibration” option, the pixel values of the image were converted into a standardized measure of radar backscatter. The “Terrain Correction” utilized a Digital Elevation Model (DEM) to minimize geometric distortions caused by terrain variations.
Finally, the data was saved to a DIM and TIFF formats for further analysis.

Using the TIFF file, the coordinates in the EPSG 4326 system were converted to pixel numbers on the raster. These numbers were used in the "Subset" option to crop the raster to the predefined area of interest. The data for both VV and VH polarization were converted from a linear scale to a decibel scale and saved into two separate TIFF files. The data processing in both graphs takes approximately 7.5 minutes.

The RVI was calculated using the formula: RVI = (4 × VH) / (VV + VH).
In the resulting map (below), blue areas indicate the absence of vegetation, which could be water (Vistula River in the southeastern part) or harvested fields; pink areas represent low vegetation, and yellow areas represent forests.

This approach highlights a less commonly explored application of radar data in vegetation monitoring and detection. By leveraging Sentinel-1 data and the Radar Vegetation Index (RVI) on CREODIAS platform, it was demonstrated that effective vegetation analysis can be achieved even in challenging conditions where optical data is not available.
Author: Zuzanna Słobodzian, the student of the Faculty of Geology, Geophysics and Environmental Protection at AGH University of Science and Technology in Poland.
The project was carried out as part of the summer student internship at CloudFerro.

