Monitoring Urban Sprawl with Sentinel-1 SAR data: Pixel Value and Polarization Thresholding
Author: Tomasz Furtak, Data Scientist at CloudFerro
In recent decades, the rapid growth of urban populations has led to significant challenges in the world's largest cities. This phenomenon, often accompanied by urban sprawl, has reshaped landscapes and strained resources, presenting complex issues for urban planners and policymakers.
Urban sprawl refers to the uncontrolled expansion of urban areas into surrounding rural lands, often resulting in inefficient land use, increased traffic congestion, and environmental degradation. This typically involves low-density development, with a spread-out pattern of housing, commercial centers, and infrastructure, leading to the fragmentation of natural habitats and agricultural land. See this article.
One solution to this phenomenon is the implementation of general plans, which can enable better city and infrastructure organization by addressing both local and broader perspective projects. Various large cities conduct such comprehensive plans. A perfect example is the Spanish general plan for the development of the Madrid Metropolitan Area, known as Madrid Nuevo Norte. This project aims to transform the northern part of Madrid, enhancing urban connectivity and creating new residential, commercial, and green spaces. The plan also focuses on sustainable development, improving public transportation, and increasing job opportunities to boost the local economy.
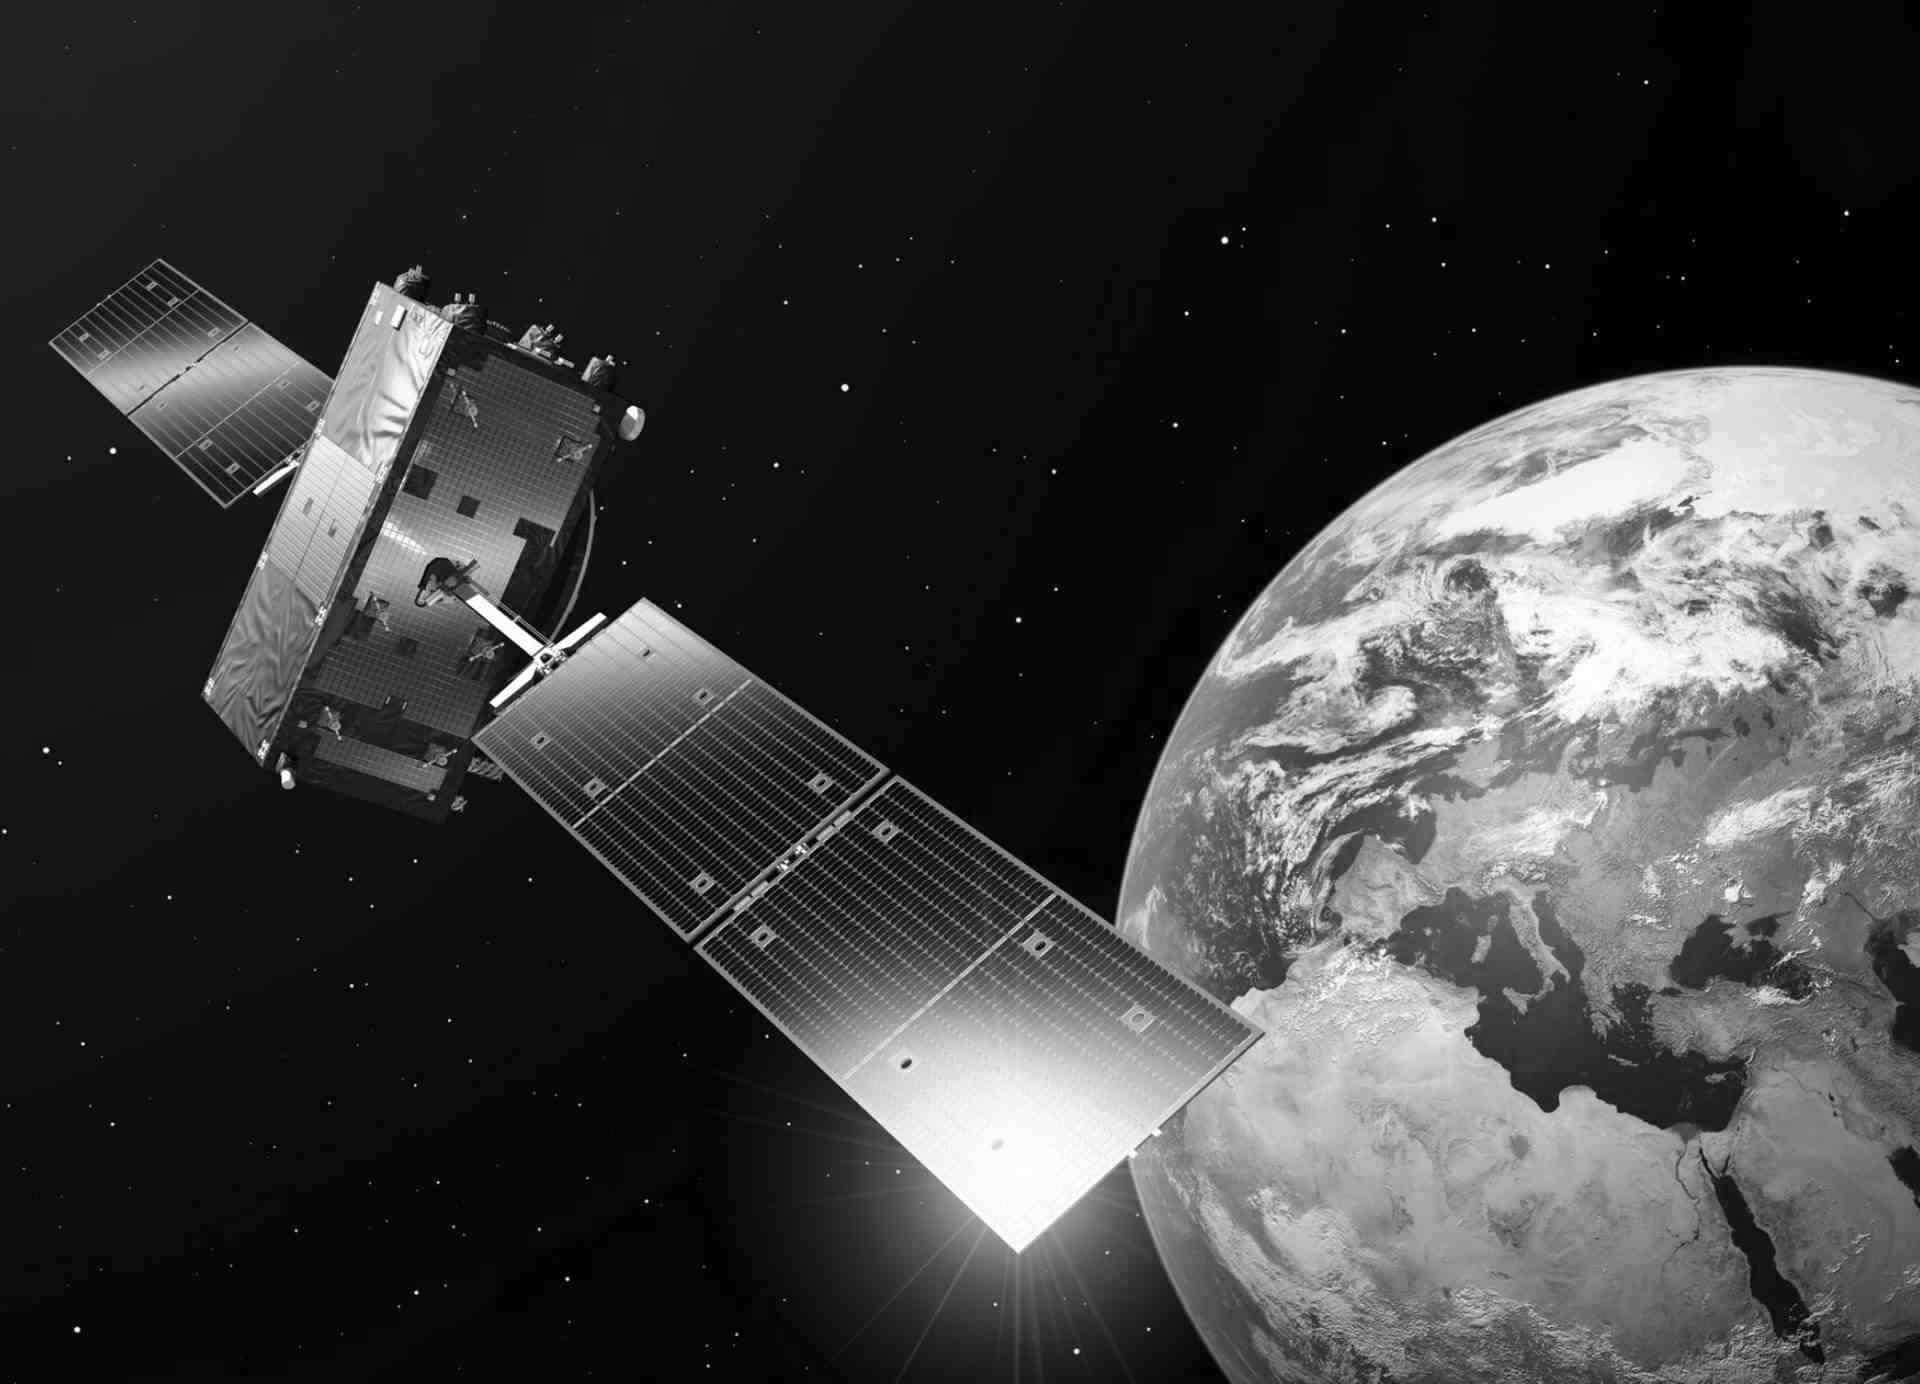
Urban sprawl can be objectively measured through a satellite data analysis. This method allows for detailed assessment of the surface area, the size, and the structure of urban areas. Various types of satellite data, including SAR data from Sentinel-1 or optical data from Sentinel-2, can be used for these measurements. The analysis focuses on the backscatter intensity values of SAR pixels and the radiometric values of optical pixels, both of which can be effectively utilized in the study. Both satellite missions provide images with a spatial resolution of 10 meters.
In Sentinel-1 data, pixel values correspond to the radar signal intensity recorded by the satellite. This intensity varies based on factors such as surface roughness, composition, and moisture content of the terrain. Analyzing these values allows detailed monitoring of land cover, urban development, and environmental changes over time. Sentinel-1 transmits microwave signals to Earth and receives their reflections. A critical aspect is polarization—electric field orientation relative to the Earth's surface. It uses two main types: Vertical (VV) oscillates vertically, Horizontal (HH) oscillates horizontally. VV penetrates vegetation well; HH offers detailed surface info, chosen based on terrain and needs, enabling data on terrain, urban growth, geology, and global conditions.
In the next part of the article, an example of the usage of Sentinel-1 data is provided, along with a detailed explanation of the steps taken. You can find all the technical documentation here.
To access the satellite data, a Python script was used. The data was downloaded from the CREODIAS platform using the API and the boto3 library by defining query parameters. CREODIAS is a cloud platform that provides access to Copernicus Earth Observation data, enabling users to process and analyze large datasets. It leverages the power of cloud computing to offer scalable and efficient data retrieval and storage solutions.
Next, the data processing was conducted using a Python script. The steps taken in the processing were:
Step 1: Decibel Conversion
Converting pixel values from intensity to decibels (dB) is crucial because it enhances the interpretability of radar data. Radar backscatter values are often highly dynamic and logarithmic decibel scale helps in normalizing these values, making it easier to compare across different scenes and reducing the range of values to a more manageable scale.
Step 2. Histogram Creation
Creating histograms of decibel values allows us to visualize the distribution of backscatter intensities for both VV and VH polarizations. This helps in understanding the range and spread of values within the image, aiding in the selection of appropriate threshold values for urban classification.

Step 3. Threshold Selection
Choosing suitable thresholds based on the histograms is necessary to distinguish urban areas from other land cover types. Thresholding converts the continuous range of decibel values into a binary classification (urban or non-urban). Optimal thresholds are selected to maximize the separation between urban and non-urban classes while minimizing misclassification errors.
Step 4. Pixel Value Reassignment
After selecting thresholds, reassigning pixel values based on these thresholds effectively classifies each pixel as urban (where the backscatter values exceed the threshold) or non-urban. This step transforms the radar intensity image into a binary urban mask, which is essential for subsequent quantitative analysis.

Step 5: Data Fusion
Combining the thresholded images from both VV and VH polarizations into a single binary mask ensures more robust classification results. This fusion process leverages the complementary information provided by different polarization channels, enhancing the accuracy of urban area detection.

Step 6: Quantitative Analysis
Performing quantitative analysis involves calculating the total number of urban pixels and subsequently estimating the urban area in hectares. This step provides meaningful metrics such as the percentage of the image covered by urban areas, enabling assessment and comparison of urban sprawl over time and across different regions.
Expanding the analysis of urban sprawl using Sentinel-1 data can be achieved through advanced processing techniques, such as multi-spectral or multi-temporal analysis. These approaches enable a deeper exploration of urban dynamics over time, offering insights into urban growth patterns and land cover changes. Additionally, integrating Sentinel-1 data with high-resolution optical imagery or ground truth data can enhance the accuracy and reliability of urban area classification.
Machine learning techniques, such as classification algorithms (e.g., decision trees, SVM), can also be employed for automated urban area classification based on Sentinel-1 data. Incorporating Sentinel-2 data, which provides optical spectrum information, and fusing it with Sentinel-1 data through data fusion techniques can add supplementary information and improve classification accuracy.
Furthermore, employing advanced spatial and simulation modeling allows for forecasting future urban expansion and assessing its potential environmental and societal impacts. These strategies collectively contribute to a more comprehensive understanding of urbanization processes and aid in effective urban planning and management strategies.

