


Semantic search of satellite data with AI embeddings
Authors: Bartosz Augustyn (Data Science Trainee, CloudFerro), Marcin Kluczek (Data Scientist, CloudFerro), Dr Jędrzej S. Bojanowski (Director of EO Data Science & Products, CloudFerro)
The rapid growth of AI and the role of embeddings in satellite imagery
Computers, unlike us don't naturally "see" or "read" the way humans do. When we look at a satellite image, we recognize more or less what is depicted in it. Images like a forest, a desert or a snowy mountain are instantly understandable because our brains connect visual cues with meaning. A computer, however, only processes raw image pixels or text characters, both interpreted as numbers. Without a deeper representation, it treats them as numbers and can only rigidly classify them as forest or lake, which often misses nuances and subtle relationships.
Embeddings change this. Instead of viewing an image or a sentence as a group of random numbers, embeddings transform them into vectors - lists of numbers that capture their essential characteristics. For an image, these numbers might encode if (and how much) greenery, water, or snow is present. For plain text, they might capture semantic aspects such as whether a word relates to climate, location, or geological activity.
For example, a forest and a mountain scene may both contain vegetation, so their embeddings will be closer to each other in this numerical space. A desert, on the other hand, has almost no greenery, so will be far away.

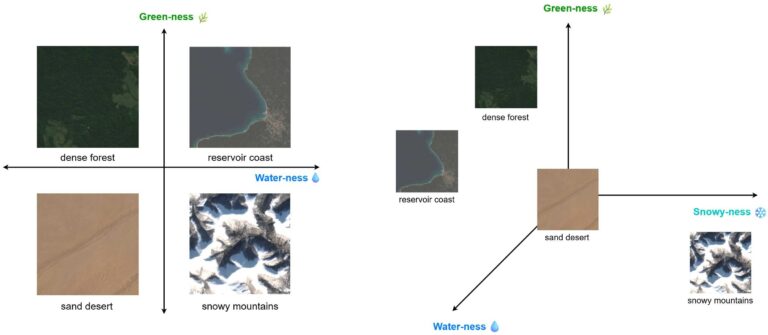
To make this simple from a numerical perspective, imagine plotting landscapes in a two‑dimensional space. One axis measure green density on the image and another water content. The desert would be in the bottom left corner with values close to zero on both axes. The water reservoir - high on both axes. The forest goes high on green but low in water dimension.
We could add a third dimension to this space, describing snow occurrence in an image. The relative positions of the images tell us which landscapes are similar in numerical terms, and which are very different. Now desert stays low in all dimensions, forest and lake have close similarity due to coastline presence in the image and mountain range stays alone far into snow dimension.
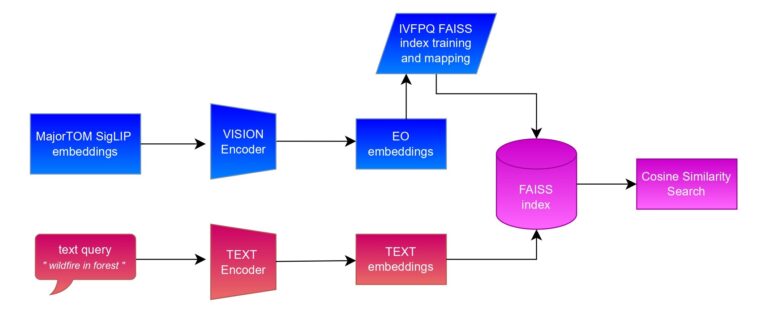
The real breakthrough comes when both text and images are mapped into the same embedding space. To achieve it, we use the SigLIP model, which has two separate encoders for that exact purpose. In this shared space, a query like "snow-covered mountains" will land close to images that actually contain snowy peaks. A forest scene and a water reservoir with coastline will be numerically closer to each other than either is to a desert, because they share features like vegetation and water.
This is a significant change because it allows computers to understand meaning through numbers. By comparing distances in this embedding space, the system can retrieve the most relevant results for a query - whether the input is text or an image. This alignment is what allows natural language queries to directly retrieve relevant images. Searching for "burn scar" can return satellite images of burned landscapes, even if the original file was just marked "California, August 2021". In short, embeddings give machines a way to grasp concepts in a measurable, flexible, and human-like way.
Searching Millions of Vectors in Seconds
For the MajorTOM-core project, which focuses on providing unified standard for large-scale EO datasets, CloudFerro in cooperation with European Space Agency (ESA) generated large embeddings datasets. SigLIP-SO400M-384 model dataset contains more than 20 million embeddings covering the entire Earth surface. Even though it's not the heaviest one, with a size of more than 40 GB the search process is very time-consuming for every query.
This is where FAISS (Facebook AI Similarity Search) comes in. FAISS is a specialized library optimized for fast nearest‑neighbor search in high‑dimensional, massive vector spaces. Instead of scanning every vector one by one, it uses clever indexing and quantization techniques to find the closest matches in just a fraction of the time.
We can look at it as if you want to find a specific sentence from a book with 20 million sentences, without knowing the page number. Reading the book every time cover to cover would take forever just to quote one sentence. FAISS solves this by dividing the book into chapters and subchapters, so the search only happens in the most promising sections rather than the entire volume.
On top of that, we apply a clever compression trick that makes each data point lighter without losing its meaning. Thanks to these optimizations, the dataset that originally took up more than 40 GB can be reduced to just 3–15 GB (depending on training settings). As a result, vector space queries can be searched through and answered in just a few seconds - with only a very small trade‑off in search quality.
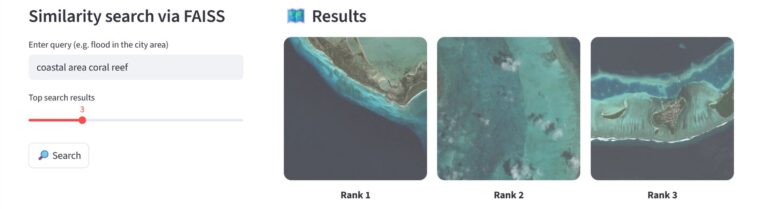
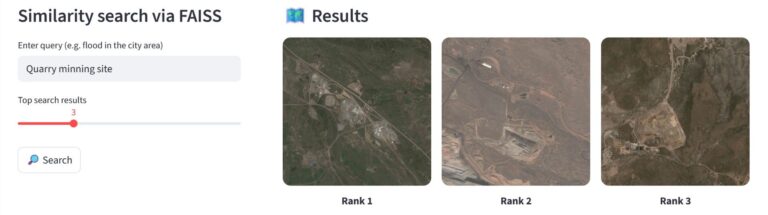
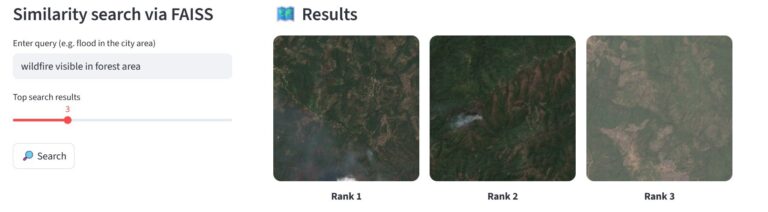
The system returns visualizations of the most relevant image patches with high probability. For example, queries such as “coastal area coral reef”, “quarry mining site”, or “wildfire visible in forest area” give back precise results almost instantly. This is because the heavy lifting happens during the initial clustering and indexing steps, so once the system has narrowed down the right data neighborhood, retrieving more matches adds almost no extra cost. In practice, this means you can freely adjust the number of results without worrying about slowing down the process.
Next Steps
At the moment, the dataset is calculated for a single scene per area, since it covers the entire Earth’s surface. This already enables fast and accurate global searches, but it doesn’t capture changes over time, periodic events, or even model EO specification.
In the future, we plan to extend the system with a proper time‑series dimension, allowing queries not only about where something is, but also when it appeared or evolved. On top of that, narrowing the search to a specific area of interest (AOI) will make results even more precise and relevant. Together, these improvements as well as application of the new version - SigLIP2 model, will open the door to higher‑quality insights - from tracking seasonal changes in ecosystems to monitoring human activity with far greater detail.
References
- Czerkawski, M., Kluczek, M., Bojanowski, J. S. 2024. Global and Dense Embeddings of Earth: Major TOM Floating in the Latent Space. arXiv. https://doi.org/10.48550/arXiv.2412.05600/
- Francis, A., Czerkawski, M. 2024. Major TOM: Expandable Datasets for Earth Observation. arXiv. https://doi.org/10.48550/arXiv.2402.12095/
- Douze, M., Guzhva, A., Deng, C. 2024. The Faiss library. arXiv. https://doi.org/10.48550/arXiv.2401.08281/
- https://huggingface.co/Major-TOM
- https://browser.stac.dataspace.copernicus.eu
- https://github.com/facebookresearch/faiss