


Detecting anomalies in satellite data with AI embeddings
Authors: Bartłomiej Ostrowski (Participant of the Internship Programme at CloudFerro), Marcin Kluczek (Data Scientist, CloudFerro), Dr Jędrzej S. Bojanowski (Director of EO Data Science & Products, CloudFerro)
How AI embeddings help detect anomalies
AI foundation models are increasingly applied to advanced image analysis, including satellite imagery. These models can extract meaningful patterns from complex datasets, supporting tasks such as classification, regression, and anomaly detection. With models pretrained specifically on Earth Observation data, it is possible to analyze large-scale satellite imagery efficiently and accurately, uncovering insights that are difficult to obtain using traditional methods.
These models produce embedding vectors, numerical representations of text, images, or videos that capture relationships within the data. Embeddings enable the identification of similarities, trends, and seasonal patterns that may not be apparent from raw data. Analyzing high-dimensional embeddings requires dimensionality reduction, as direct interpretation in n-dimensional space is impractical. Principal Component Analysis (PCA) is commonly used to project data into a lower-dimensional space, often 2D, for visualization while preserving key relationships. Another approach to compare embeddings is cosine similarity, which measures the angle between vectors. This metric emphasizes the directional similarity between vectors, independent of their magnitude, reflecting semantic relationships.
For satellite data analysis, we used the same foundation models as in previous studies, including the SSL4EO-S12, DINOv2, and SigLIP based on radar Sentinel-1 and optical Sentinel-2 data (Czerkawski et al., 2024). Using our expertise in computing embeddings and the CREODIAS infrastructure, we efficiently generated high dense time series of embeddings. Analyses were performed on our EODATA archive, hosted in S3 cloud storage as well as STAC catalog, which allowed rapid filtering and retrieval of satellite imagery metadata. The workflow followed the MajorTOM standard (Francis & Czerkawski, 2024), ensuring reproducibility and consistency across datasets while applying the foundation models to identify temporal and spatial patterns.
Monitoring water level changes in a Spanish reservoir for years 2016-2021
An example of using embeddings for anomaly detection is the case of the Embalse de la Serena. This reservoir located in Spain (38.9° N, 5.1° W) has experienced notable environmental changes in recent years.
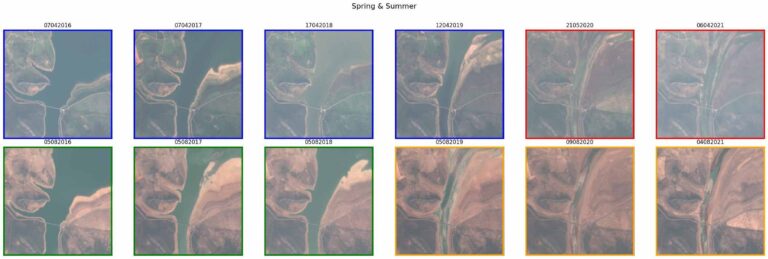
The analysis uses Sentinel-2 L1C imagery (Fig. 1), covering spring and summer series from 2016 to 2021, and embeddings from multispectral SSL4EO model.
Using PCA analysis (Fig. 2), differences in conditions before and after partial drying become apparent. The most significant change occurs in 2019: spring conditions appear typical (blue rectangles indicate spring, while green rectangles represent summer), but a shift begins in summer (black ellipse).
The sudden change in the first principal component (PC1) is an effect of environmental changes. The change of water coverage turned out to be permanent in the next years (red rectangles correspond to spring, and orange rectangles to summer).
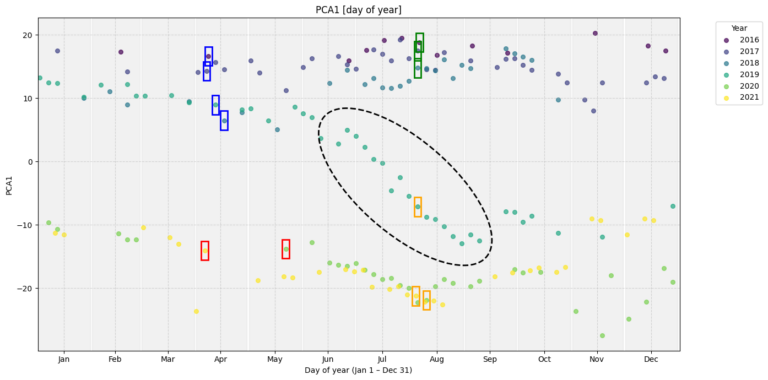
This analysis highlights how embeddings can be used to detect anomalies in satellite imagery, identify when changes first occurred, and determine whether they persisted over time.
Flood in southern Poland, 2024
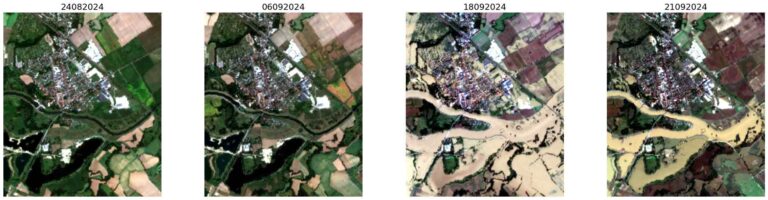
Another example of applying AI models for anomaly detection is the flood that occurred in southern Poland in 2024. In this case, the SigLIP model, which processes three spectral bands, was used together with Sentinel-2 L2A data. The images below (Fig. 3) show selected samples. Particular attention should be paid to 18 and 21 September 2024, when flooding occurred in the town of Lewin Brzeski (50.7° N, 17.6° W).
The PCA distribution for this dataset is presented in Fig. 4, applying the same analytical approach as in the earlier example. Seasonal variation is captured by the spline fit line, while outliers visible at the start of the year (black rectangle) typically correspond to snow-covered areas.
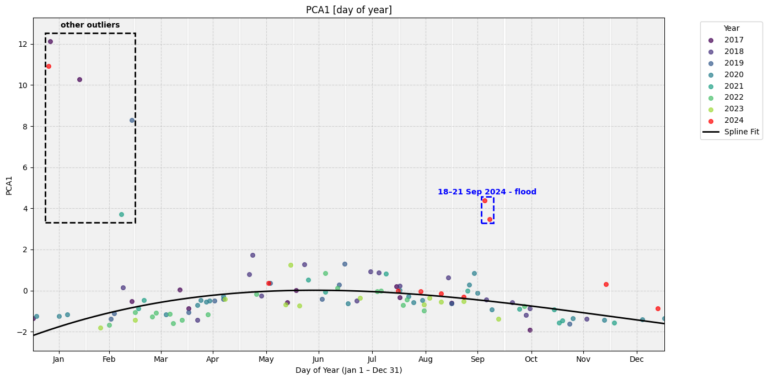
Besides the outliers at the start of the year, we can observe two points that are noticeable different from the others. These represent data from 18 and 21 September 2024, during the flooding.
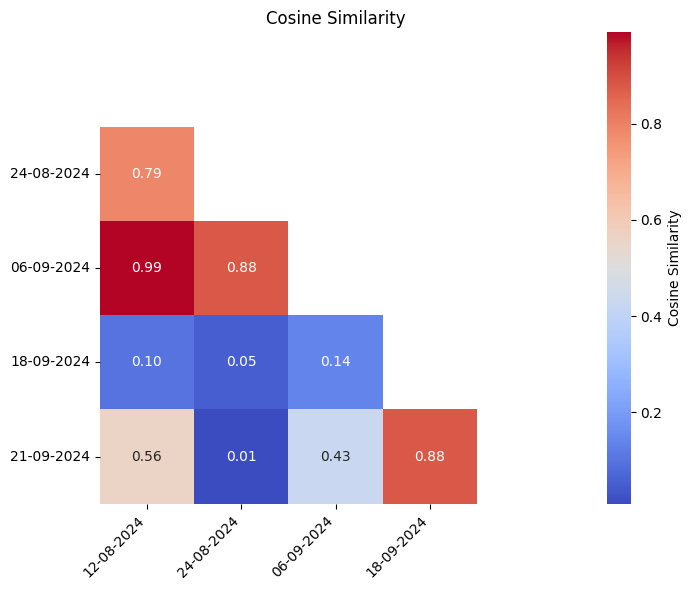
Another way to detect anomalies is by using the cosine similarity between embedding vectors. The matrix shown in Fig. 5 illustrates similarity values before and during the flood, clearly highlighting two distinct states.
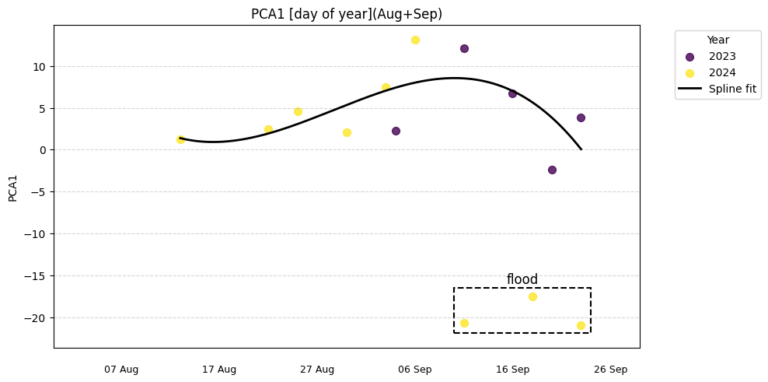
In addition to optical data, radar imagery can be employed. A major advantage of radar is its robustness to cloud cover, which often complicates optical analyses during extreme weather events. For this purpose, the Sentinel-1 SSL4EO-S1 model was applied. PCA was again used on radar data for August and September, with the flood period clearly marked (black rectangle) in Fig. 6.
Summary and perspectives
The presented examples illustrate how embeddings can be applied for anomaly detection in satellite imagery, using different data sources and analytical metrics such as PCA and cosine similarity. These methods not only accelerate the detection process but also make results easier to interpret.
Beyond anomaly detection, embeddings have the potential to support large-scale monitoring of environmental changes, which is particularly relevant in the context of resilience planning and civil security. By enabling systematic analysis of dense time series, they can be applied to detect and track evolving phenomena across extensive geographic areas.
Looking ahead, we plan to further develop the use of embeddings, extending their application beyond anomaly detection. Future work will focus on exploring their potential for modeling and analyzing diverse environmental variables and long-term changes.
References
Czerkawski, M., Kluczek, M., Bojanowski, J. S. 2024. Global and Dense Embeddings of Earth: Major TOM Floating in the Latent Space. arXiv. https://doi.org/10.48550/arXiv.2412.05600/
Francis, A., Czerkawski, M. 2024. Major TOM: Expandable Datasets for Earth Observation. arXiv. https://doi.org/10.48550/arXiv.2402.12095/
https://creodias.eu/news/creodias-updated-with-advanced-global-ai-embeddings/
https://creodias.eu/news/transforming-earth-observation-with-global-ai-embeddings/